Practical guide
Stacked Bar Colors: Check Segment Edges and Labels Separately
Test the fills that actually touch, then test the labels. A complete 100-unit stack shows why white-background ratios alone miss internal edges.
On this page
A white-background check does not test touching fills
Check the colors that actually touch. A blue segment and an orange segment can each be visible on white while offering very little lightness separation at their shared edge. Their individual background ratios do not answer that adjacent-fill question.
First identify the task. If readers must infer the split between stacked segments from the graphic, the dividing edge contributes information. Test that edge. If complete visible names and values communicate the same information, the source explains that those graphical parts may no longer be required for understanding. That is a defined information alternative, not a reason to leave the text unreadable.
Basis: [2]
The example here uses both exact labels and white separators. It demonstrates an ordinary opaque digital stack. It does not certify a chart product, every display size or a printed result.
Inspect a complete 40/35/25 example
The constructed dataset has three categories: A 40, B 35 and C 25 fictional units. Their sum is 100, so their shares are 40%, 35% and 25%. The horizontal stack has widths in those same proportions. There are no omitted categories or missing records.
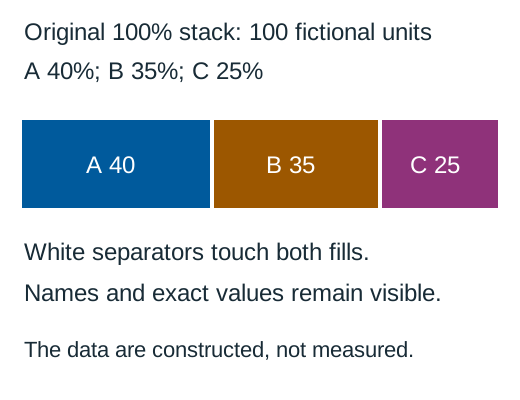
Download the original labelled SVG
On a narrow screen, scroll inside the table. The region can receive keyboard focus.
| Category | Value | Share of 100 | Opaque fill |
|---|---|---|---|
| A | 40 | 40% | #005A9C |
| B | 35 | 35% | #9C5700 |
| C | 25 | 25% | #8F327A |
Download the complete original CSV
The graphic has a white background. Every colored segment has a white boundary, and its white text sits directly on that segment. A different background, opacity or label color would require different pair calculations.
Calculate segment, separator and text pairs
On a narrow screen, scroll inside the table. The region can receive keyboard focus.
| Pair | Color 1 | Color 2 | Calculated ratio |
|---|---|---|---|
| A against white | #005A9C | #FFFFFF | 7.136726: 1 |
| B against white | #9C5700 | #FFFFFF | 5.560171: 1 |
| C against white | #8F327A | #FFFFFF | 7.228426: 1 |
| A beside B | #005A9C | #9C5700 | 1.283544: 1 |
| B beside C | #9C5700 | #8F327A | 1.300036: 1 |
All three dark fills have more than 4.5: 1 contrast against white. However, A/B and B/C are each below 3: 1. Saying “all colors passed on white” would miss both shared edges. A white separator supplies a new adjacent pair on each side; here each separator/fill pair exceeds 3: 1.
The white labels use the same white/fill pairs, but ordinary text needs 4.5: 1 rather than the 3: 1 graphical-object threshold. Evaluate the unrounded ratio. A line-style improvement cannot compensate for a label that becomes unreadable against its own fill.
s = channel_byte /255
linear(s) = s/12.92 if s <=0.04045 else ((s+0.055)/1.055)**2.4
L =0.2126*linear(R)+0.7152*linear(G)+0.0722*linear(B)
ratio =(max(L1,L2)+0.05)/(min(L1,L2)+0.05)
These are nominal opaque sRGB calculations. Antialiasing, a thin separator and tiny text can make the exported chart less usable, so inspect its actual small-size result as well.
Keep the separator without changing the data
A separator is a visual boundary, not an extra category. Keep the underlying 40/35/25 proportions intact. In this original SVG, the white strokes sit over the mathematical boundaries. They slightly cover the nearby fills; the complete table prevents that visual width from becoming the only source of exact percentages.
Avoid creating a new gap that silently changes the total length, or subtracting a fixed number of units from every segment to make room. Very small segments can be visually consumed by a thick boundary. A chart with dozens of thin pieces may need a different layout or direct labels outside the stack.
If the question is an exact difference such as “Is B five units below A?”, 40 and 35 answer it directly. Ask whether a labelled table or grouped bars would serve that comparison more clearly. Stacks emphasize composition; a palette cannot make every internal baseline equally convenient to compare.
Handle narrow segments and real exports
A 25% segment has room for a short label in this illustration. A real 1% category might not. Move its name and value to a clearly attached outside label, or give a complete adjacent table. Do not squeeze important text into a tiny colored sliver and then assume a passing color ratio solves its size.
Keep category names attached to their values. A legend with colored chips alone does not give someone a visible alternative to recognizing the hue. A label such as “A 40” can convey both category and value; a vague title such as “Composition” cannot.
Review the actual phone chart, full-size export and any static screenshot. Check that the white separators remain visible, labels do not overlap and all categories remain accounted for. If paper output matters, use a separate proofing process; an on-screen sRGB ratio is not a paper/profile measurement.
Try three boundary decisions
Use the stated opaque colors and 100-unit dataset for these original checks.
Case 1
A and B each exceed 3: 1 against white. Does that establish 3: 1 for their shared edge?
Show answer and explanation for case 1
No. The shared edge uses the A/B pair.
Calculate those adjacent fills. Their ratio is below 3: 1 even though both white-background checks pass.
Case 2
Can a white separator improve the needed boundary in this example?
Show answer and explanation for case 2
Yes. White contrasts with both neighboring fills.
Each side has a white/fill pair above 3: 1. Retain the exact data and check actual stroke visibility; do not invent a fourth segment.
Case 3
Does passing the 3: 1 edge check establish that ordinary text within a segment is readable?
Show answer and explanation for case 3
No. Text has a separate 4.5: 1 threshold.
The example’s white text also exceeds 4.5: 1 on all three fills. A different label color could fail while the edge still passes.
Sources and further reading
- W3C: Understanding Use of Color, SC 1.4.1Visible alternatives to color-assigned meaning, including the distinction between visible cues and information supplied only to assistive technology.
- W3C: Understanding Non-text Contrast, SC 1.4.11Required graphical information, actual adjacent pairs, chart-edge examples and equivalent visible labels and values.
- W3C: Understanding Contrast (Minimum), SC 1.4.3Ordinary-text 4.5: 1 and qualifying-large-text 3: 1 thresholds, unrounded comparisons and sRGB luminance/contrast definitions.