Practical guide
Overlapping Scatter Points: Show Counts Without Moving Coordinates
Count exact coordinate and category collisions before changing colors. Six original records show how to preserve locations and reveal records hidden by overlapping marks.
On this page
A visible marker may stand for several records
Check the underlying records before changing marker colors or shapes. If several records have exactly the same x and y values, later markers can cover earlier ones. Different shapes do not guarantee that every category remains visible at a completely shared coordinate.
For this original example, group records by exact coordinate and category. Show the total count at the original coordinate, and provide the category counts and full record table. This keeps every coordinate unchanged while exposing how much information a single mark would otherwise hide.
Aggregation is a presentation choice, not permission to discard source records. A constant-size marker labelled “3” means three records here; its area does not encode their count. State that convention so readers do not infer bubble-size weighting.
Basis: [1]
Read all six records and their collisions
Download the original labelled SVG
On a narrow screen, scroll inside the table. The region can receive keyboard focus.
| Record ID | Category | x | y |
|---|---|---|---|
| r1 | Alpha | 2 | 3 |
| r2 | Alpha | 2 | 3 |
| r3 | Beta | 2 | 3 |
| r4 | Alpha | 5 | 6 |
| r5 | Beta | 5 | 6 |
| r6 | Beta | 8 | 4 |
Download all six original records
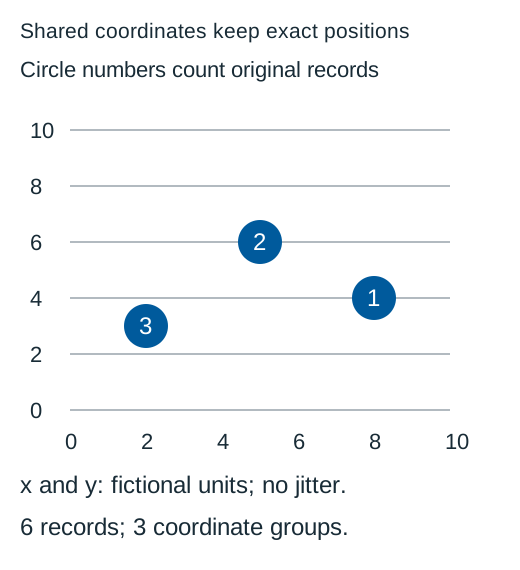
r1 and r2 are Alpha at (2, 3), and r3 is Beta there too. r4 is Alpha at (5, 6), where r5 is Beta. r6 is Beta at (8, 4). Plotting all six as same-size opaque symbols can make only three positions apparent, even though six records exist.
Both axes use fictional units. The example does not describe measured people, products or a statistical association. It addresses record visibility rather than a causal conclusion.
Aggregate coordinates and categories without moving them
On a narrow screen, scroll inside the table. The region can receive keyboard focus.
| x | y | Alpha count | Beta count | Total |
|---|---|---|---|---|
| 2 | 3 | 2 | 1 | 3 |
| 5 | 6 | 1 | 1 | 2 |
| 8 | 4 | 0 | 1 | 1 |
from collections import Counter

category_counts =Counter((r["x"],r["y"],r["category"]) for r in records)
coordinate_counts =Counter((r["x"],r["y"]) for r in records)
# Retain original records; count exact keys without changing x or y.
The grouped totals are 3+2+1=6. Alpha has 2+1+0=3 records, and Beta has 1+1+1=3. Those category totals agree with the original table. There are three unique coordinate pairs, not three total records.
A real grouping needs the dataset’s coordinate precision. Exact equality is deliberate here. Do not round coordinates into a shared bin without describing that change; nearby values and identical values are different claims.
Choose a visible count, separate panels or disclosed displacement
A labelled coordinate total makes density visible while keeping location exact. Supply category counts because the total alone does not show which categories share the position. A stacked glyph or short attached group label may help, but test it at the intended display size.
Separate category panels can show Alpha and Beta at their original coordinates using the same axes. Counts are still necessary for Alpha’s two records at (2, 3). Splitting by category removes cross-category occlusion, but it does not remove same-category duplicates.
Jitter can separate marks visually. It changes displayed positions, so retain the original values and explain the displacement, units and method. Do not let an offset mark imply that the record’s exact x value was different. The illustration here uses no jitter.
Opacity may reveal accumulation in some situations, but it can blend colors and obscure category identity. A darker patch is not an exact count unless a documented mapping establishes it. A visible count and ordinary text table provide a clearer answer for this small dataset.
Keep identity, counts and coordinates recoverable
Name the categories visibly rather than instructing readers to count blue or orange dots. In this example, the coordinate-count graphic is supported by both the category table and the complete original records. An equivalent data description is useful independently of the visual marks.
Check the count labels against their fill. The original circles use white text on opaque #005A9C, whose nominal sRGB ratio exceeds 4.5: 1. Circles are the same size; their position conveys coordinates and their number conveys count.
Basis: [3]
When exporting, keep axis range, units, count convention and the full record data. A static image loses hover controls, hidden categories and detailed tooltips. If you provide an inspection interaction in a real chart, test keyboard and touch use as well as the exported state.
For a large or private dataset, a full public record table may be inappropriate. Choose a lawful equivalent that preserves the needed information without exposing confidential records. This original fictional dataset has no such hidden data or privacy claim.
Try three overlap decisions
Use all six original records and the exact stated coordinates.
Case 1
Does seeing three plotted positions prove that there are only three records?
Show answer and explanation for case 1
No. There are six records at three coordinates.
The coordinate totals are 3, 2 and 1. Occlusion can hide duplicates and another category at the same position.
Case 2
Do separate Alpha/Beta panels remove every overlap in this dataset?
Show answer and explanation for case 2
No. Alpha still has two records at (2, 3).
Separate panels remove cross-category overlap, but within-category duplicates still need a count or another documented representation.
Case 3
Can moving a dot from x=2 to x=2.1 be presented as its original coordinate?
Show answer and explanation for case 3
No. That would misstate its exact location.
A deliberate jitter display can be explained while preserving original values, but it must not claim the shifted coordinate was the supplied data.
Sources and further reading
- W3C: Understanding Use of Color, SC 1.4.1Visible alternatives to color-assigned meaning, including the distinction between visible cues and information supplied only to assistive technology.
- W3C: Understanding Non-text Contrast, SC 1.4.11Required graphical information, actual adjacent pairs, chart-edge examples and equivalent visible labels and values.
- W3C: Understanding Contrast (Minimum), SC 1.4.3Ordinary-text 4.5: 1 and qualifying-large-text 3: 1 thresholds, unrounded comparisons and sRGB luminance/contrast definitions.