Practical guide
Heatmap Legend Ranges: Make Every Boundary Unambiguous
Define exact inclusive and exclusive endpoints before assigning heatmap colors. Complete decimal and boundary examples keep the legend, code and displayed values consistent.
On this page
Make each cut point belong to exactly one class
Specify the endpoints, not only the color names. A legend reading “0–10, 10–20, 20–30” does not tell a reader which interval receives exactly 10 or 20. The implementation should not choose silently.
For the original continuous-value example here, Low is 0≤v<10, Middle is 10≤v<20, and High is 20≤v≤30. The first two bins are half-open, and the final bin includes the upper domain endpoint. These are deliberately constructed classes, not a real service-level, clinical or financial scale.
Choose thresholds from the actual dataset definition and question before copying these numbers. A sequential scheme can represent ordered levels, but its colors do not justify the thresholds or tell a reader which endpoint is included.
Basis: [4]
Read the exact boundary test dataset
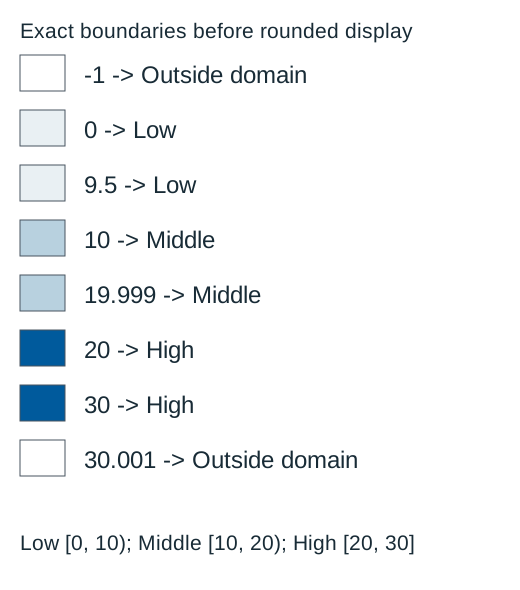
Download the original labelled SVG
On a narrow screen, scroll inside the table. The region can receive keyboard focus.
| Original value | Expected class | Decisive comparison |
|---|---|---|
| -1 | Outside domain | Below 0 |
| 0 | Low | 0≤v<10 |
| 9.5 | Low | Less than 10 |
| 10 | Middle | 10≤v<20 |
| 19.999 | Middle | Less than 20 |
| 20 | High | 20≤v≤30 |
| 30 | High | Upper endpoint included |
| 30.001 | Outside domain | Greater than 30 |
Download all original test values
Download the exact rule and scope record
The 19.999 input belongs to Middle. If a display rounds it to 20.00, the visible shortened number may look like a High value. Keep enough visible precision, show the class label and disclose rounding when it can change the apparent interpretation.
Use an exact comparison rule
import math

def classify(value):
    if not math.isfinite(value):
        raise ValueError("Nonfinite input")
    if 0 <=value <10:
        return "Low"
    if 10 <=value <20:
        return "Middle"
    if 20 <=value <=30:
        return "High"
    return "Outside domain"
This Python example assumes a previously parsed numeric input in the stated unit. Missing values, text fields and nonfinite values need their own input handling. Do not convert a missing field to 0 just to enter the first bin; that is a different data-state problem.
The comparisons are mutually exclusive and cover every finite value in the 0..30 domain. Values outside it receive an explicit state instead of silently clamping to the nearest color. Clamping can be a deliberate visualization choice, but it needs disclosure and must not pretend the data were inside the allowed range.
Test below, at and above each boundary. For a general configurable system, check that break points are strictly increasing, intervals have the intended units and the last endpoint is handled deliberately. An empty range or reversed break should be a validation failure rather than an attractive swatch.
Keep units and precision consistent
Do not classify fraction-scale inputs with thresholds defined in percent units. A stored fraction of 0.1 may be displayed as 10%, while a percent-scale field stores 10 for that same fraction. Convert to the classification’s declared numeric unit before comparing the thresholds; formatting alone does not convert the underlying input.
Classify the intended original numeric value before formatting. If the actual policy requires rounding first, write that policy explicitly and test it; do not let a chart label formatter become an undocumented decision rule.
Avoid adding arbitrary epsilon tolerances to move values between classes. Some measurements have defined precision or uncertainty, but that definition must come from the actual data process. The simple original cases here use their stated finite inputs and literal boundaries.
Make the legend and cell label tell the same story
Write the interval notation or plain-language equivalent: “at least 10 and below 20” is unambiguous. Pair a color with a visible class name and actual number where practical. A hover-only tooltip should not be the sole route to the cutoff definition.
Basis: [1]
For small cells, supply an ordinary text table or equivalent way to inspect every value. Keep that information in the export as well. A colored screenshot with a cropped legend loses the classification contract, even if every cell has a beautiful fill.
Check text against its actual fill and necessary visual cues against relevant neighbors. The original High swatch is dark, while its numeric text is placed outside the swatch on white. The sample illustrates classification, without asserting that three numeric bins require every adjoining shade to be 3: 1 from the next.
Try three exact-cutoff decisions
Use the stated half-open bins and the unrounded original values.
Case 1
Which class receives exactly 10?
Show answer and explanation for case 1
Middle.
Low excludes 10; Middle includes it. This explicit endpoint rule prevents both overlap and a gap.
Case 2
Should 19.999 become High merely because its displayed value rounds to 20.00?
Show answer and explanation for case 2
No, under the shown policy.
Classification uses the original numeric value before display formatting. It remains below 20 and therefore Middle.
Case 3
Should 30.001 receive the High fill as if it were inside the domain?
Show answer and explanation for case 3
No. It is Outside domain in this example.
The stated upper endpoint is 30 inclusive. A deliberate clamping policy would be a different documented choice, not the rule shown here.
Sources and further reading
- W3C: Understanding Use of Color, SC 1.4.1Visible alternatives to color-assigned meaning, including the distinction between visible cues and information supplied only to assistive technology.
- W3C: Understanding Non-text Contrast, SC 1.4.11Required graphical information, actual adjacent pairs, chart-edge examples and equivalent visible labels and values.
- W3C: Understanding Contrast (Minimum), SC 1.4.3Ordinary-text 4.5: 1 and qualifying-large-text 3: 1 thresholds, unrounded comparisons and sRGB luminance/contrast definitions.
- ColorBrewer: Sequential, diverging and qualitative schemesSequential, diverging and qualitative schemes; ordered values, categorical identity and a meaningful central reference.