Practical guide
Heatmap Colors: Keep Missing, Zero and Not Applicable Distinct
Keep numeric zero, not-observed and not-applicable states explicit. Six original records show how color choices and denominators change when those meanings are lost.
On this page
Decide the data state before choosing the fill
Zero is a value; a missing measurement is not. Keep “not applicable” separate too: it says the measurement is outside the record’s defined scope, rather than merely unavailable. The palette should follow those distinctions instead of erasing them.
This article uses explicitly constructed records. An observed zero belongs in numeric calculations. A not-observed cell and a not-applicable cell have no numeric value here. Other datasets may define statuses differently; obtain that definition before replacing blanks or calculating a summary.
Give each nonnumeric state a visible name, abbreviation with a key, or another clear cue. A pale cell alone cannot tell a reader whether it means a low value, absence or exclusion. The accessible table and exported records should preserve the same distinctions.
Basis: [1]
Read the complete six-cell example
Download the original labelled SVG
On a narrow screen, scroll inside the table. The region can receive keyboard focus.
| Row | Period | Numeric value | Observation status |
|---|---|---|---|
| A | P1 | 0 | observed |
| A | P2 | — | not observed |
| A | P3 | — | not applicable |
| B | P1 | 8 | observed |
| B | P2 | 4 | observed |
| B | P3 | — | not applicable |
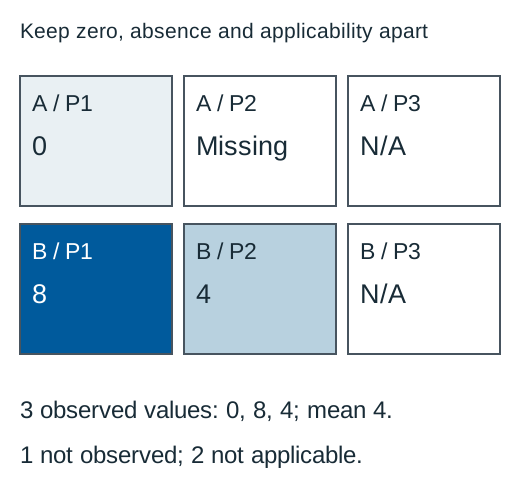
A/P1 was observed and equals 0. A/P2 should have had a measurement under this example’s design, but it was not observed. A/P3 and B/P3 are not applicable. B/P1 and B/P2 were observed as 8 and 4 fictional units.
Download the complete status-preserving CSV
The blank numeric field in the CSV does not stand alone: a separate status field explains it. Importing just the numeric column would lose information. The text table uses an em dash for no numeric value and writes its reason in the status column.
Calculate the summary without converting absence to zero
There are three observed values: 0, 8 and 4. Their known subtotal is 12. Their observed-value mean is 12/3=4 fictional units. The two not-applicable cells and the one not-observed cell do not belong in that denominator.
On a narrow screen, scroll inside the table. The region can receive keyboard focus.
| Calculation | Result | Interpretation |
|---|---|---|
| 12/3 | 4 | Mean of the three observed values |
| 12/4 | 3 | Incorrect here: treats one missing observation as zero |
| 12/6 | 2 | Incorrect here: treats both N/A cells and missing observation as zeros |
The subtotal 12 is a subtotal of available observations. It is not proof that every eligible record totals 12, because A/P2 is unknown. If the task requires an eligible-population total, report incomplete coverage rather than presenting the observed subtotal as complete.
If a dataset calls for imputation, document its method and retain the original state. This example performs no imputation. Neither a palette nor a charting library’s default replacement rule supplies a valid missing-data policy.
Keep zero inside the numeric scale
The illustration gives 0 a pale numeric fill, 4 an intermediate fill and 8 a dark fill. The number remains visible in each cell. These are original sample colors and values, not universal thresholds or a measured perceptual scale.
The missing and N/A cells use white with different visible words. Their distinction does not depend on a gray-versus-blue difference. A pattern can reinforce a state, but a legend should still say what it means, and the numeric palette should not assign an invented value to it.
Check text against each actual fill. Do not assume black works on every dark value cell; the 8 cell uses white text. A white border or outline may help locate cells, but the text and complete table supply the exact state/value information. This is not a blanket claim that heatmaps are exempt from contrast requirements.
Keep the same meaning in imports, filters and exports
Preserve row identity, period, numeric value, status and unit together. Validate combinations: an “observed” row needs its numeric value, including zero; a “not applicable” row should not silently carry a numeric replacement. Reject ambiguous input or ask for the data definition before coloring it.
When filtering to observed records, show that the result contains three of six cells. A summary label such as “Mean of observed values; 3 records” explains the scope better than “Average 4” alone. If you show coverage, distinguish the one eligible missing observation from the two out-of-scope records.
For an exported image, keep the status key and the exact-data table or a linked equivalent. Hover-only explanations disappear in print and screenshots. Review the phone layout so the word “Missing” and the N/A definition remain available without interpreting hue.
Try three observation-state checks
These answers apply to the complete six-record example, without imputation.
Case 1
Should observed 0 be removed from the mean because its pale fill looks empty?
Show answer and explanation for case 1
No. It is a numeric observation.
Including 0 with 8 and 4 gives 12/3=4. Pale appearance does not change its recorded status.
Case 2
Can A/P2 be entered as 0 to make the eligible mean easier to calculate?
Show answer and explanation for case 2
Not under this example’s definition. It is unknown.
Changing its blank value to 0 would create an observation that was not supplied. The resulting 12/4=3 would be a different, unsupported calculation.
Case 3
Is 12 a verified complete total for all eligible observations?
Show answer and explanation for case 3
No. It is the known observed subtotal.
A/P2 is eligible but not observed. Its unknown value prevents a complete eligible total; the two N/A cells have a different exclusion reason.
Sources and further reading
- W3C: Understanding Use of Color, SC 1.4.1Visible alternatives to color-assigned meaning, including the distinction between visible cues and information supplied only to assistive technology.
- W3C: Understanding Non-text Contrast, SC 1.4.11Required graphical information, actual adjacent pairs, chart-edge examples and equivalent visible labels and values.
- W3C: Understanding Contrast (Minimum), SC 1.4.3Ordinary-text 4.5: 1 and qualifying-large-text 3: 1 thresholds, unrounded comparisons and sRGB luminance/contrast definitions.
- ColorBrewer: Sequential, diverging and qualitative schemesSequential, diverging and qualitative schemes; ordered values, categorical identity and a meaningful central reference.